How to Read a Profit and Loss Statement (Without an Accounting Degree)
A profit and loss statement tells you whether your business is making or losing money — and why.
A profit and loss statement — also called an income statement or P&L — is a one-page summary of whether your business made or lost money over a specific period. It's the most important financial report your business produces, and you don't need an accounting degree to understand it.
If your eyes glaze over when your accountant sends the monthly financials, this guide will fix that.
What a P&L Statement Tells You
A P&L answers three questions:
- How much money came in? (Revenue)
- How much money went out? (Expenses)
- What's left? (Profit or loss)
That's it. Everything else on the statement is just detail supporting those three numbers.
The Structure (Top to Bottom)
Every P&L follows the same basic structure. Here's what each section means — and what to actually look for.
Revenue (Top Line)
This is all the money your business earned during the period — before any expenses are subtracted. Also called "sales," "income," or "top line revenue."
What to look for: Is revenue growing, flat, or declining compared to last month/quarter/year? If you have multiple revenue streams, which ones are growing and which are shrinking?
Cost of Goods Sold (COGS)
These are the direct costs of delivering your product or service. For a consulting firm, that's contractor labor. For an e-commerce business, that's inventory and shipping. For a SaaS company, that's hosting and infrastructure.
Not every business has meaningful COGS. Service businesses with no contractors and no physical products might skip this section entirely.
Gross Profit
Revenue minus COGS. This tells you how much money you made from your core business before overhead costs.
Gross margin (gross profit / revenue) is the percentage you keep from every dollar of revenue after direct costs. A healthy gross margin depends on your industry:
- Professional services: 50–80%
- SaaS: 70–85%
- E-commerce: 30–50%
- Restaurants: 60–70%
If your gross margin is shrinking over time, you're either charging too little or your direct costs are rising faster than your revenue.
Operating Expenses
These are the costs of running the business that aren't directly tied to delivering your product or service. Rent, salaries, marketing, insurance, software subscriptions, office supplies.
What to look for: Any expense that's growing faster than revenue is a problem. Review each category monthly — subscription creep is real, and most businesses are paying for tools they no longer use.
Operating Income (EBIT)
Gross profit minus operating expenses. This is your profit from actual business operations — before interest, taxes, and any one-time items.
This is the number that tells you whether your business model works. Revenue can be high, but if operating expenses eat it all, you don't have a sustainable business.
Other Income and Expenses
Interest earned on bank deposits, interest paid on loans, one-time gains or losses (selling equipment, legal settlements, etc.). These are real but separate from your core business operations.
Net Income (Bottom Line)
Operating income plus/minus other items, minus taxes. This is your actual profit — what's left after everything.
This is the number people mean when they ask "is your business profitable?"
A Real P&L: Annotated Example
Let's look at a realistic P&L for a small marketing consultancy — one owner, two contractors, about $300K in annual revenue. This is March 2026:
PROFIT & LOSS STATEMENT
River Creative Consulting LLC
March 2026

REVENUE
  Consulting services          $22,500
  Strategy workshops            $3,500
  Retainer clients              $8,000
                               ───────
  TOTAL REVENUE                $34,000

COST OF GOODS SOLD
  Subcontractor payments        $6,400
  Project software (client)       $280
                               ───────
  TOTAL COGS                    $6,680

GROSS PROFIT                   $27,320
  Gross Margin: 80.4%

OPERATING EXPENSES
  Owner salary (payroll)        $8,333
  Payroll taxes & benefits      $1,250
  Rent (co-working space)         $450
  Software subscriptions          $387
  Marketing & advertising         $600
  Professional development        $150
  Insurance                       $175
  Accounting & legal              $250
  Meals & entertainment           $120
  Office supplies                  $85
  Bank fees                         $0
  Miscellaneous                    $45
                               ───────
  TOTAL OPERATING EXPENSES     $11,845

OPERATING INCOME               $15,475
  Operating Margin: 45.5%

OTHER INCOME / EXPENSES
  Interest income (bank)           $52
  Interest expense (loan)        –$125
                               ───────
  NET OTHER                      –$73

NET INCOME BEFORE TAX          $15,402
  Estimated tax provision       –$4,621
                               ───────
NET INCOME                     $10,781
  Net Margin: 31.7%
What Each Line Tells You
Revenue ($34,000): Three revenue streams — project consulting is the biggest, followed by retainers, then workshops. If consulting drops next month but retainers hold steady, you know retainers are the stable base.
COGS ($6,680): Mostly contractor payments. At 80.4% gross margin, this business keeps $0.80 of every dollar after direct costs. That's excellent for a consulting firm. If gross margin drops below 70%, it means the owner is outsourcing too much work (eating into margins) or undercharging for projects that require contractors.
Operating Expenses ($11,845): Owner salary is the biggest line item — expected and healthy. The software line ($387/month = $4,644/year) is worth reviewing quarterly: how many of those subscriptions are actually used? Marketing at $600/month is reasonable for a $34K/month business, but track the return — is that spend generating leads?
Operating Income ($15,475): A 45.5% operating margin is strong. This means after paying the owner, contractors, and all overhead, almost half of revenue remains. For a solo consulting firm, anything above 30% is healthy.
Net Income ($10,781): After tax provisions, the owner nets $10,781 in profit beyond their $8,333 salary. Over a year at this rate, that's $129,372 in additional profit — available for distributions, reinvestment, or building reserves.
Five Things to Check Every Month
You don't need to analyze every line item. Focus on these five things — with specific red flags and actions for each.
1. Revenue Trend
Is it going up, down, or flat compared to last month and the same month last year? A single month doesn't tell you much — look at the 3-month and 12-month trend.
🚩 Red flag: Revenue drops more than 15% from the prior month without a seasonal explanation. Two consecutive months of decline is a pattern, not a blip.
Action: Identify which revenue stream dropped. Is it a lost client? Fewer projects? Lower average project size? The fix depends on the cause — a lost retainer client requires different action than a slow month in project work.
2. Gross Margin
If it's dropping, investigate immediately. Either your pricing is off or your direct costs are creeping up. This is the earliest warning sign of a problem.
🚩 Red flag: Gross margin drops below your industry benchmark (for services: below 60%; for e-commerce: below 25%) or drops more than 5 percentage points in a single month.
Action: Pull a report of COGS by category. Did contractor costs spike? Did material costs increase? Are you giving discounts that aren't reflected in your pricing strategy? If gross margin drops below 40% two months in a row, your pricing or COGS structure needs a hard look — you're working harder for less money.
3. Biggest Operating Expenses
What are your top 3 costs? Are any growing faster than revenue? Most businesses find that payroll is #1 (which is expected) but #2 and #3 are worth scrutinizing monthly.
🚩 Red flag: Any non-payroll expense that increases more than 20% month-over-month without a clear reason. Software, marketing, and "miscellaneous" are the usual culprits.
Action: Drill into the category. For software: export the list of charges and audit each one. For marketing: is the increased spend producing results? For miscellaneous: recategorize these — a catch-all category that grows over time usually contains expenses that should be tracked elsewhere.
4. Net Income
Positive is good, negative needs attention. But don't panic over a single negative month — look at the trend. Seasonal businesses regularly have loss months followed by profitable ones.
🚩 Red flag: Net income is negative for 3 consecutive months (for non-seasonal businesses), or net margin drops below 5% consistently.
Action: Compare to the same period last year. If revenue is up but profit is down, the problem is cost control. If revenue is down and costs are flat, the problem is sales. Build a simple 3-month cash runway forecast: at the current net income (or loss), how many months can you sustain operations?
5. Anything Unusual
Scan for line items that look different from prior months. A sudden spike in "Professional Services" might mean an unexpected legal bill. A jump in "Software" might mean someone signed up for a new tool. These anomalies are often where waste hides.
🚩 Red flag: Any new line item that didn't exist last month, or an existing line item that doubles.
Action: Find the specific transaction(s) behind the anomaly. If it's a one-time cost (legal fee, equipment purchase), consider whether it should be on this month's P&L or amortized over several months. If it's a new recurring cost, make sure it was approved and is delivering value.
P&L vs Balance Sheet vs Cash Flow Statement
Your P&L is one of three core financial statements. Here's how they relate — and how the same business event shows up differently on each.
| Statement | Question It Answers | Time Frame |
|---|---|---|
| P&L (Income Statement) | Did you make money this period? | A period (month, quarter, year) |
| Balance Sheet | What do you own and owe right now? | A single point in time |
| Cash Flow Statement | Where did cash come and go? | A period (same as P&L) |
Same Event, Three Different Stories
Example: You buy a $6,000 laptop for your business on March 15.
On the P&L:
If you use Section 179 expensing, the full $6,000 shows as an expense in March. Your net income drops by $6,000 this month. Alternatively, if you depreciate it over 5 years, only $100 shows as an expense this month ($6,000 ÷ 60 months), and your net income only drops by $100.
On the Balance Sheet:
Your cash (asset) decreases by $6,000. Your equipment (asset) increases by $6,000 (or $5,900 after one month of depreciation). Net assets stay roughly the same — you traded one type of asset (cash) for another (equipment). If you financed the laptop, cash doesn't change, but you gain a $6,000 equipment asset and a $6,000 loan liability.
On the Cash Flow Statement:
$6,000 cash outflow under "Investing Activities." This shows up regardless of how you handle it on the P&L. The cash flow statement always shows the actual cash movement.
This is why you need all three. A business that buys $50,000 in equipment might show a healthy P&L (only $833/month in depreciation expense) but have terrible cash flow ($50,000 out the door). Conversely, a business might show a P&L loss due to depreciation on equipment purchased years ago, while actually generating strong cash flow from operations.
Common P&L Mistakes
These are the errors that small business owners make most often — and how to fix them.
Categorizing Owner Draws as Expenses
This is the most common P&L mistake for sole proprietors and LLC owners. When you transfer money from the business to yourself, that's an owner draw — not an expense. It belongs on the balance sheet (reducing owner's equity), not the P&L.
Why it matters: If you pay yourself $60,000/year and record it as an expense, your P&L shows $60,000 less profit than you actually earned. Your gross margins look worse than reality. And if you apply for a loan, the lender sees artificially low profitability.
The fix: Owner draws should be categorized as "Owner's Draw" or "Distributions" — an equity account, not an expense category. If you're an S-Corp paying yourself a salary via payroll, the salary IS an expense (it goes on the P&L as payroll expense). But distributions beyond salary are equity withdrawals.
Not Separating One-Time Costs from Recurring Expenses
A $5,000 legal fee for incorporating a new entity is a one-time cost. Your $200/month legal retainer is a recurring expense. If they both show up as "Legal" on your P&L, your March legal expense looks like $5,200 — making it look like legal costs have exploded.
Why it matters: If you use monthly P&L data to make decisions (you should), one-time costs distort the picture. You might cut your legal budget based on inflated numbers, when the actual recurring cost is reasonable.
The fix: Either create separate line items ("Legal – Recurring" and "Legal – One-Time") or add a note on the P&L explaining the anomaly. Some accounting software lets you tag transactions as "non-recurring" for better analysis.
Mixing Personal and Business Expenses
If your business debit card pays for a personal dinner, that transaction hits your business P&L as an expense — reducing your apparent profit. If you reimburse the business from personal funds, the reimbursement might get recorded as revenue, inflating your top line.
Why it matters: Your P&L no longer reflects actual business performance. Margins are wrong, tax deductions are wrong, and any financial analysis is based on bad data.
The fix: When a personal expense accidentally hits the business account, record it as an owner draw (not an expense). When a business expense accidentally hits your personal card, reimburse yourself from the business account and record the reimbursement as the business expense it actually is.
Ignoring Depreciation
You bought a $15,000 vehicle for business use but never set up depreciation. The full $15,000 shows as an expense in the month you bought it (if you expensed it), or it doesn't show anywhere on the P&L (if you capitalized it but forgot to set up monthly depreciation entries).
Why it matters: Without depreciation, your P&L is either overstating expenses in one month (huge purchase) or understating expenses ongoing (no depreciation recorded). Both distort your true monthly profit.
The fix: Work with your accountant to set up depreciation schedules for any asset over $2,500. Most accounting software automates this once configured.
Recording Loan Payments as a Single Expense
When you make a $1,500 monthly loan payment, only the interest portion is an expense. The principal portion is a balance sheet transaction (reducing your loan liability). Recording the full $1,500 as an expense overstates your operating costs.
Why it matters: On a 5-year, $60,000 loan at 8%, your monthly payment is about $1,217. But only ~$400 is interest (in the first year) — the rest is principal. Recording the full payment as an expense overstates your monthly costs by $800+.
The fix: Split every loan payment into principal (balance sheet) and interest (P&L expense). Your bank or lender provides an amortization schedule showing the exact split.
Cash-Basis vs. Accrual-Basis: Same Business, Different Numbers
This confuses almost everyone, so let's use a concrete example.
The scenario: You're a freelance designer. In March, you:
- Completed a $5,000 project and sent the invoice on March 20 (client pays April 5)
- Received a $3,000 payment for a project completed in February
- Paid $800 for software subscriptions
- Received a $1,200 bill from your accountant (you'll pay it in April)
Cash-Basis P&L (March)
| Amount | |
|---|---|
| Revenue | $3,000 (only the cash received) |
| Expenses | $800 (only the cash paid out) |
| Net Income | $2,200 |
The $5,000 invoice? Not on the March P&L — cash hasn't arrived yet. The $1,200 accountant bill? Not here either — you haven't paid it yet.
Accrual-Basis P&L (March)
| Amount | |
|---|---|
| Revenue | $5,000 (earned in March, regardless of when paid) |
| Expenses | $2,000 ($800 software + $1,200 accountant bill incurred) |
| Net Income | $3,000 |
Same business, same month, same transactions — but one method shows $2,200 profit and the other shows $3,000.
Which should you use?
- Cash-basis is simpler and reflects your actual bank balance. It's what most businesses under $1M in revenue use, and the IRS allows it for most small businesses.
- Accrual-basis is more accurate for understanding true economic performance. It's required for businesses with inventory over $27M, and preferred by investors and lenders.
The practical advice: Use cash-basis until your accountant tells you otherwise. If you're a freelancer or small service business, cash-basis is simpler and your bank balance actually matches your P&L. Switch to accrual when you have significant accounts receivable (invoices outstanding for 30+ days), inventory, or when a lender or investor requires it.
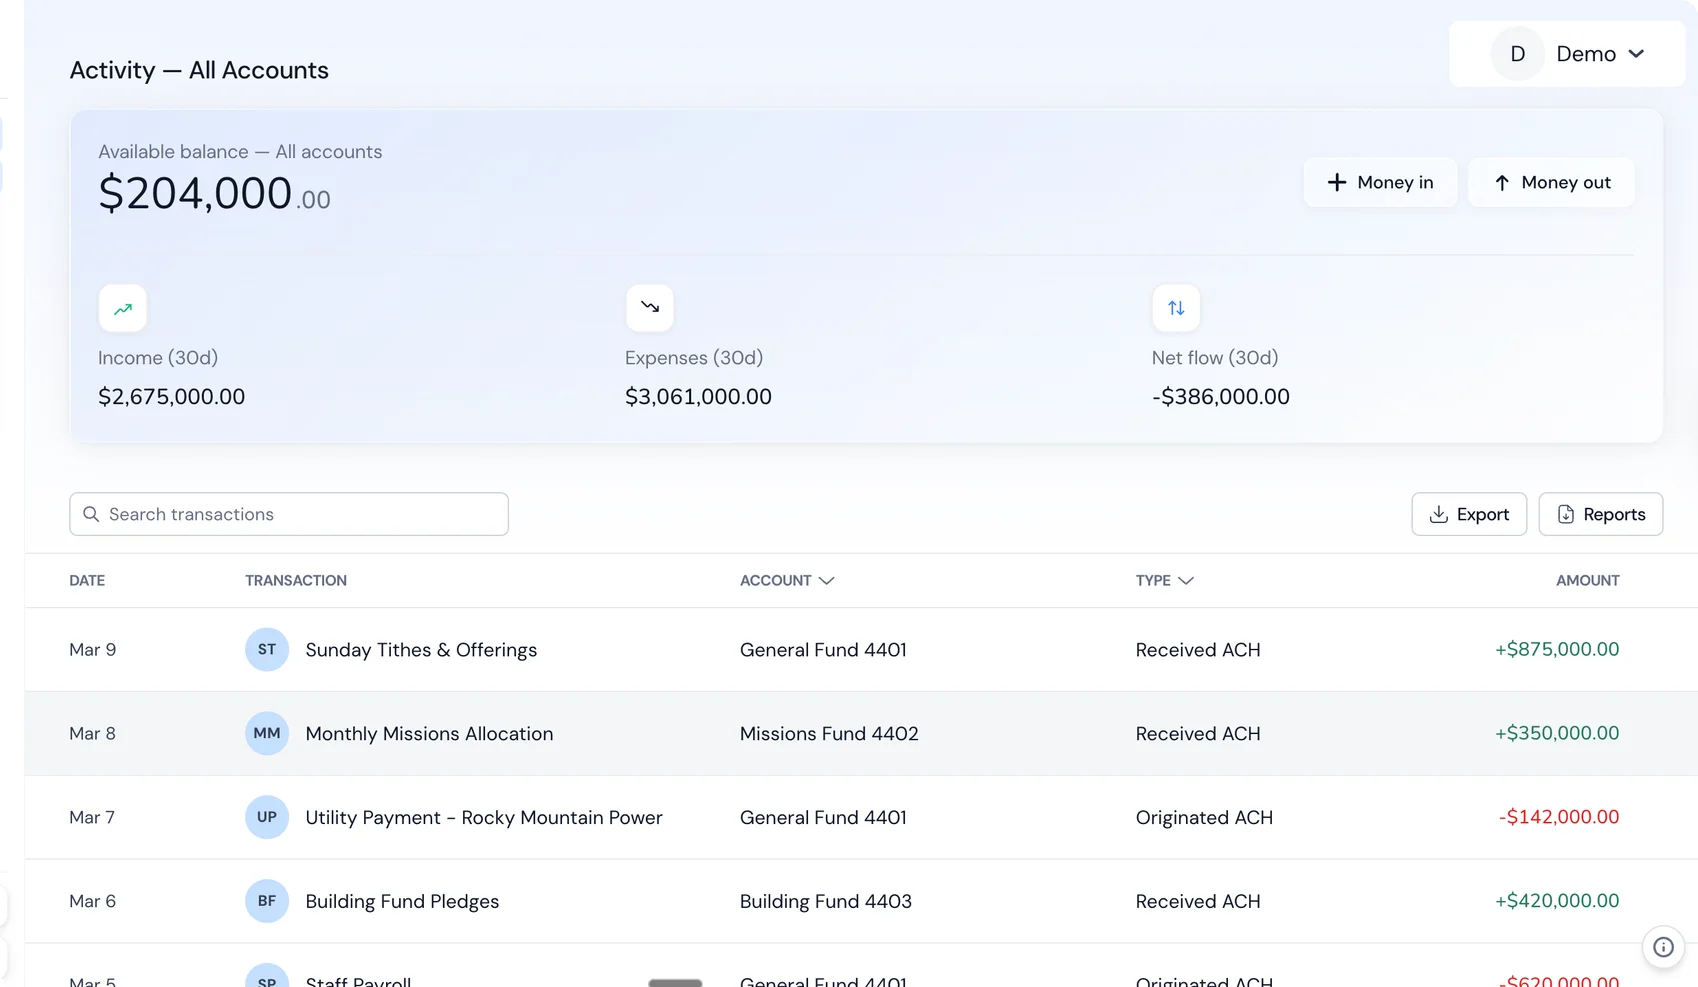
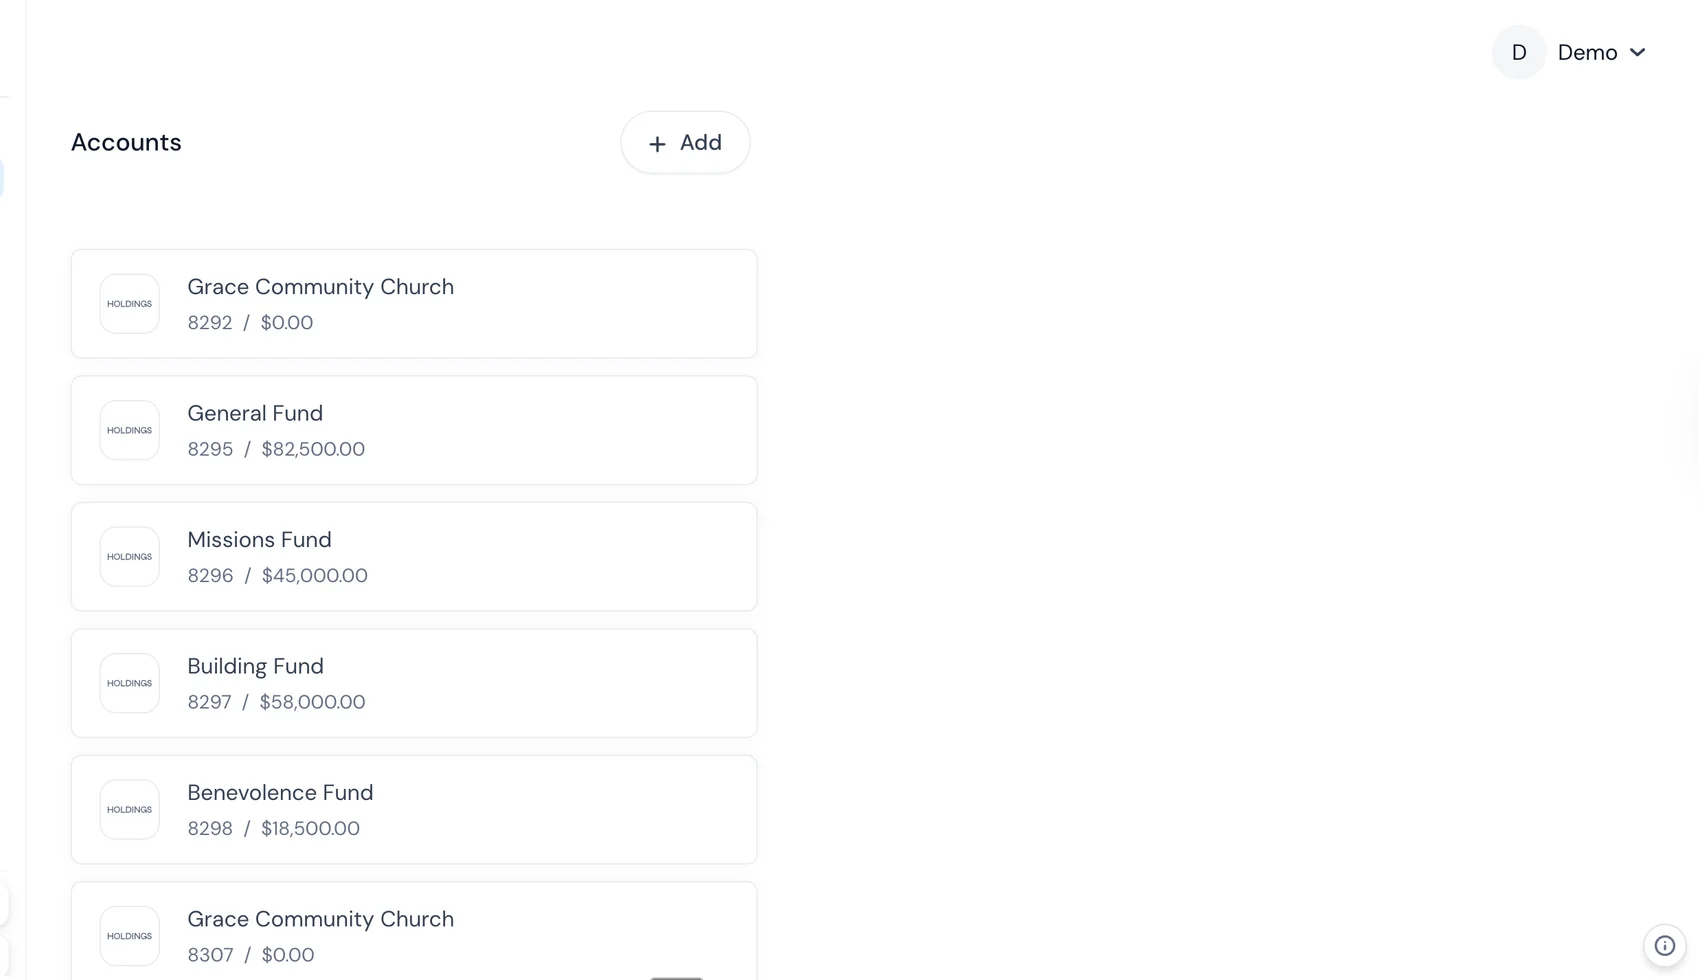
How Accounting Software Makes This Easier
If you're creating P&L statements manually from bank statements and spreadsheets — stop. Modern accounting software (or banking platforms with built-in accounting) generates P&L statements automatically by categorizing every transaction as it happens.
What used to take an accountant hours to compile is now available in real-time:
- Transactions are auto-categorized as they flow through your bank account
- P&L, balance sheet, and cash flow reports update continuously
- You can filter by date range, department, project, or account
- Monthly comparison views show trends at a glance
The best setup: your bank account and your accounting system are the same platform, so there's no sync delay, no missing transactions, and no reconciliation busywork. Your P&L is always current because every transaction is recorded the moment it clears.
Frequently Asked Questions
How often should I review my P&L?
Monthly, at minimum. A quick 10-minute review of revenue, gross margin, and net income catches problems early. Quarterly, do a deeper dive comparing to the same quarter last year and to your budget/forecast. Annual reviews should happen with your CPA as part of tax planning.
What's a good profit margin?
It depends entirely on your industry. Net margins of 10–20% are solid for most small businesses. Service businesses often achieve 20–40%. Retail and restaurants operate on much thinner margins (3–10%). Compare yourself to industry benchmarks, not arbitrary targets. The SBA and trade associations publish benchmarks for most industries.
My P&L shows profit but I have no cash. Why?
Common reasons: you have outstanding invoices (accounts receivable) — you earned the revenue on the P&L but the cash hasn't arrived. You made a large equipment purchase that's being depreciated (shows as a small expense on the P&L but was a large cash outflow). Or you're paying down debt principal (doesn't show on the P&L but reduces cash). Look at your cash flow statement for the full picture.
What's the difference between cash-basis and accrual-basis P&L?
Cash-basis records revenue when cash arrives and expenses when cash leaves. It's simple and reflects your bank balance. Accrual-basis records revenue when earned and expenses when incurred, regardless of when cash moves. It's more accurate for businesses with invoices and payment terms. Most businesses under $1M use cash-basis. See the detailed example above.
Can I switch between cash and accrual basis?
Yes, but it requires IRS approval (Form 3115, Application for Change in Accounting Method). It's not casual — you'll need to calculate a Section 481(a) adjustment to account for the transition, and your CPA should handle this. Most businesses switch once (from cash to accrual as they grow) and stay there.
What if my P&L shows a loss?
A single loss month isn't necessarily alarming — seasonal businesses, startups investing in growth, and businesses with large one-time expenses regularly show monthly losses. What matters is the trend. Three consecutive loss months in a non-seasonal business requires action: cut expenses, raise prices, or increase sales volume. Calculate your runway: at the current monthly loss rate, how many months of cash reserves do you have?
---
Holdings adds accounting software for $25/mo (30-day free trial) that generates P&L statements, balance sheets, and a general ledger automatically — no manual entry, on top of free banking and unlimited invoicing. [See how it works →](/banking)